SSV Mapping Project: If a Picture = 1,000 Words, How Many Are in a StoryMap?
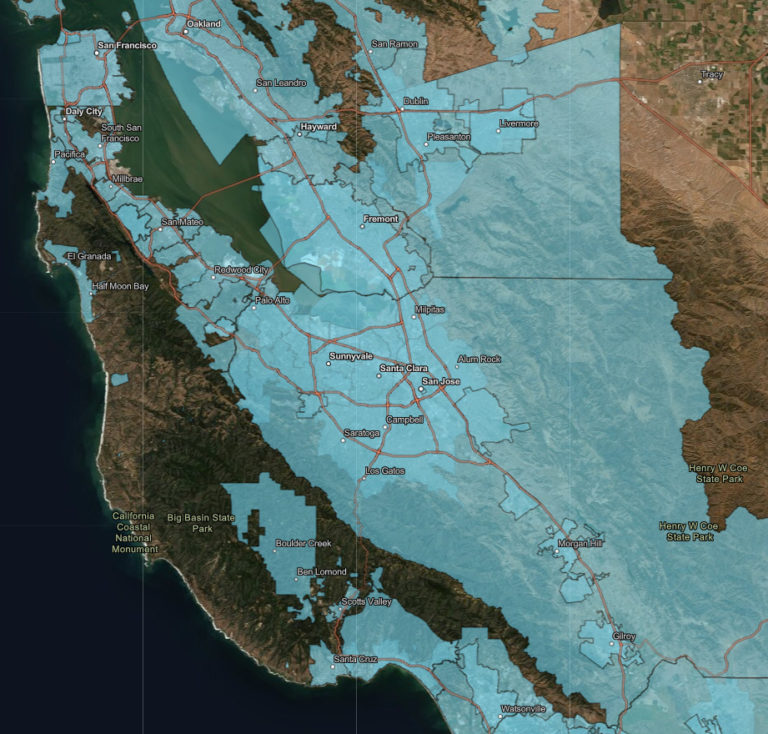
This first effort (a work still in progress) identifies retail water agencies in the Greater Bay Area. It'd dynamic: click on the map to see more.
To quote WikiPedia, “ArcGIS is a geographic information system (GIS) for working with maps and geographic information maintained by the Environmental Systems Research Institute (ESRI). It is used for creating and using maps, compiling geographic data, analyzing mapped information, sharing and discovering geographic information, using maps and geographic information in a range of applications, and managing geographic information in a database.” To us, good maps are gateways to good stories. There may be, as Emily Dickenson once opined, no frigate like a book, but a well-designed map can be a rocketship towards understanding trends, issues and problem areas.
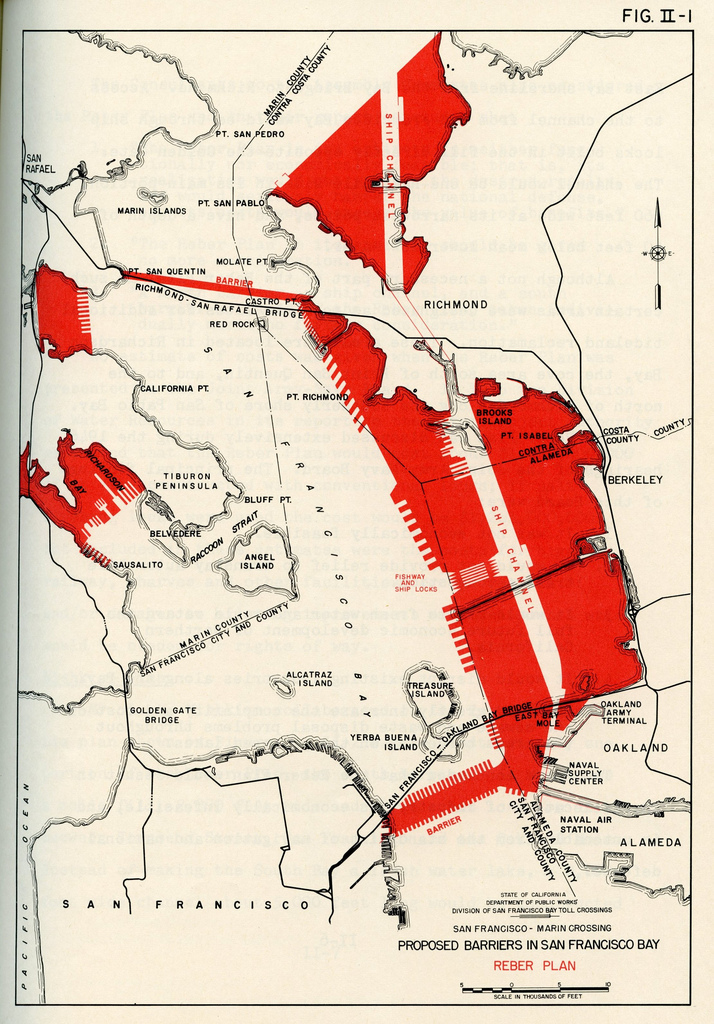
This map details the notorious Reber Plan, which threatened to "channelize" SF Bay with fill, indicated in red. Click map for link to an an in-depth article of what might have been.
Watson Hanson is a second-year Masters student in Environmental Management (Climate & Energy) at the University of San Francisco, concentrating in Geographic Information Systems through their Geospatial Analysis Lab. We’ll be collaborating on a variety of maps and stories over the next few months, drawing on the wealth of data available from sources like Cal EPA’s CalEnviroScreen 4.0, the State Water Board and the 2020 U.S. Census.
Stay tuned for some stories!
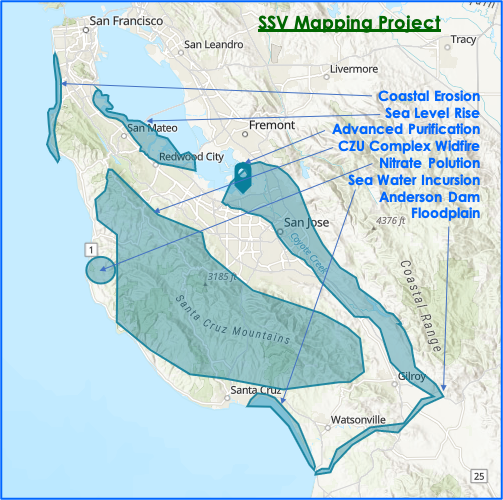
Overview of some of the areas we are looking to target in future.