SSV Launches Climate Dashboard
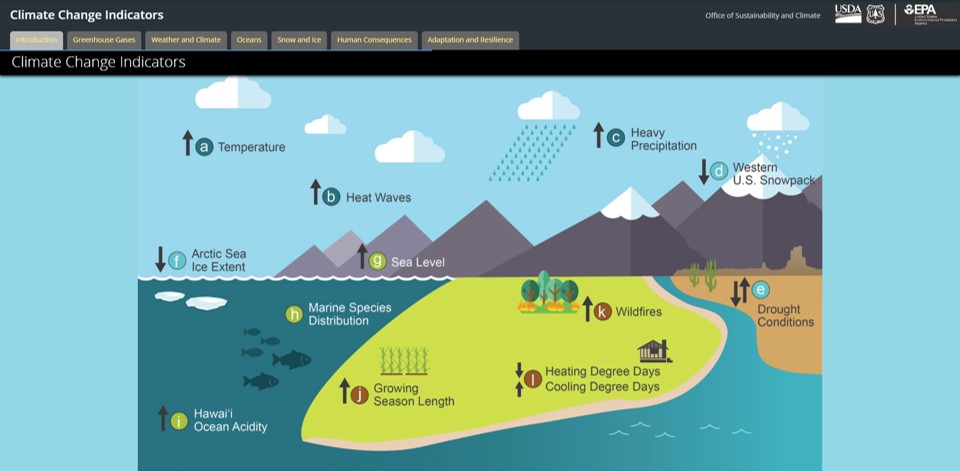
With drought, wildfires, and extreme temperatures in the Western US coupled with torrential rains, rising sea levels, and more forceful hurricanes along the Atlantic seaboard, you may be sensing that the perilous repercussions of Climate Change are playing out right now. You are right! Glaciers are rapidly melting as the world has become a hotter place and is getting hotter each year. This USDA-US Forestry/EPA Climate Change Indicators graphic illustrates how climate change interacts with every part of the environment that people live in or depend on.
In the spirit of providing “news you can use” to enhance sustainability of people and planet, the SSV team has created a Climate Dashboard. The dashboard contains information from leading websites to help us be more resilient by understanding local climate conditions today and motivated to take much needed action for a global sustainable future.
The Climate Dashboard Information
- Current state measures of air quality, temperature, wildfires, and drought conditions in the Bay Area and beyond. Websites referenced include AirNow, PurpleAir, National Weather Service, FireMappers, CA Water, and Drought Monitor
- Historical Trends & Forecasts vividly illustrate the rapid worldwide Climate Change over the past few decades, including changes in carbon dioxide & greenhouse gases, temperatures & weather, sea levels, snow & ice, etc. The world is already heated up…AND getting hotter each year! Websites referenced include: Showyourstripes, NASA Climate Time Machine, and USDA-US Forestry Service/EPA Climate Change Indicators.
Check the Climate Dashboard for the latest readings on air and water quality, temperature, and wildfires to help you plan that 50 mile bike ride or outdoor gathering. The Climate Dashboard also serves as a catalyst and motivator to spark innovation in education and activism, government policy and regulations, research and technology, conservation and consumption patterns, nature-based and healthy solutions, sustainable growth & development and whatever else is needed to preserve the well-being of people and planet.
Innovations and Improvements
On the brighter side, we also want to highlight stories about innovations to be more resilient as we face current climate change, as well as efforts aimed at mitigating the rate of future climate change.
This article highlights three ocean projects that improve water quality, provide healthful food, capture carbon, and generate renewable energy. UC Davis recently published this article about turning mud into wildfire resilient housing.
The US Energy Information Administration (EIA) recently reported that renewable energy sources (including wind, hydroelectric, solar, biomass, and geothermal energy) now accounts for 21% of the electricity generation in the U.S., inching slightly ahead of coal (19%) and nuclear (20%), for the first time on record. Natural gas(40%) continues to produce the most electricity in the US.
The US EIA also recently reported on US CO2 emissions by energy source and end-use sector. Transportation (36%) was the top end use sector, followed by Industrial (29%), Residential (20%), and Commercial (16%).
Suggestions for additional climate indicators and innovation insights may be emailed to: [email protected]