SSV Climate Dashboard
Current Measures of air quality, temperature, wildfires, and drought conditions in the Bay Area & beyond.
Historical Trends & Forecasts vividly illustrate the rapid worldwide Climate Change over the past few decades, including changes in carbon dioxide & greenhouse gases, temperatures & weather, sea levels, snow & ice, etc. The world has already heated up…AND is getting hotter each year!
Current Measures
Heat

Air Quality
Temperature & Fire Activity
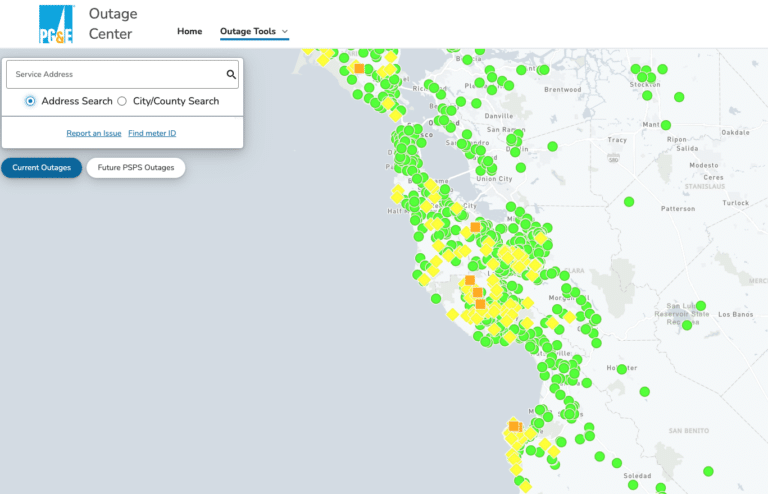
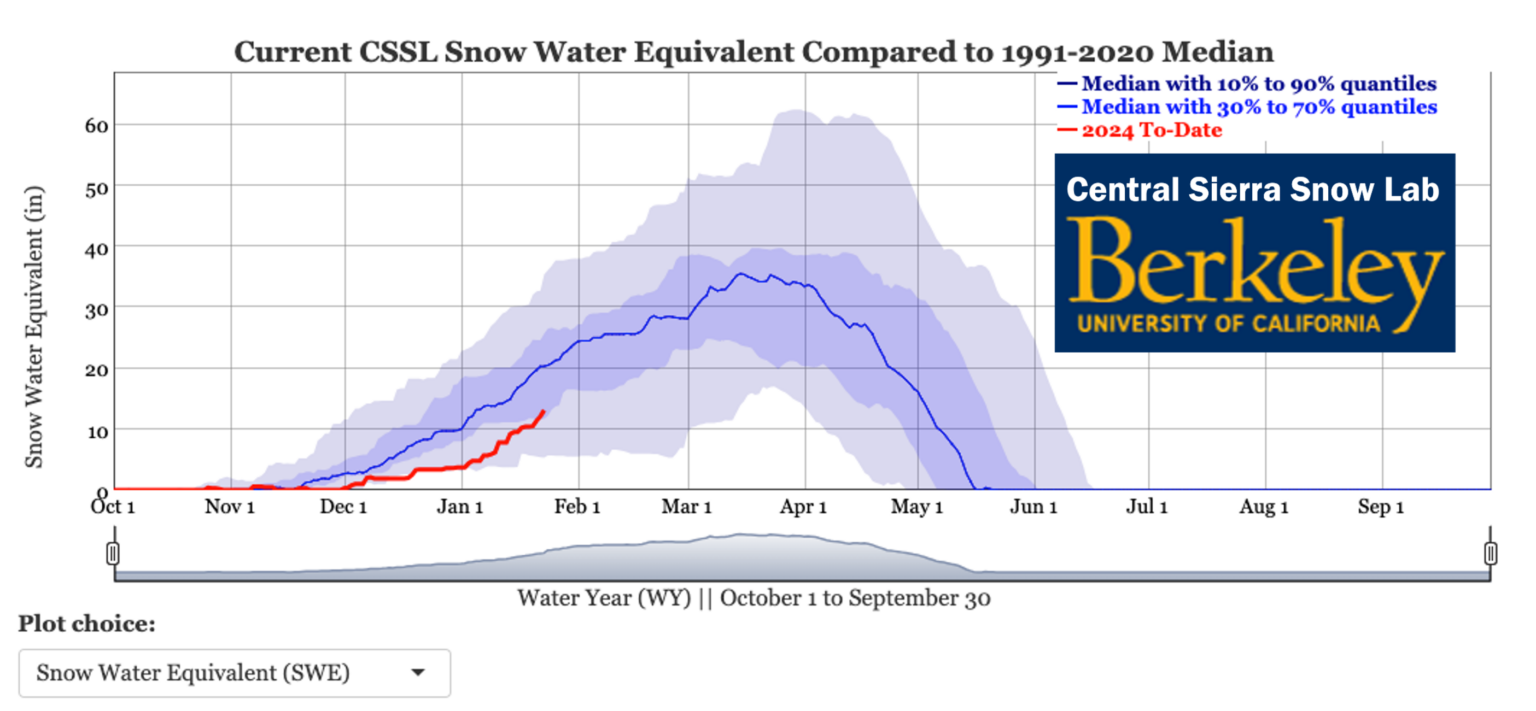
Snow Level
California Reservoir & Drought Conditions
Understanding Local Rain Flows and Climate Risks
Historical Trends & Forecasts
California Temperature Change 1895 – 2021
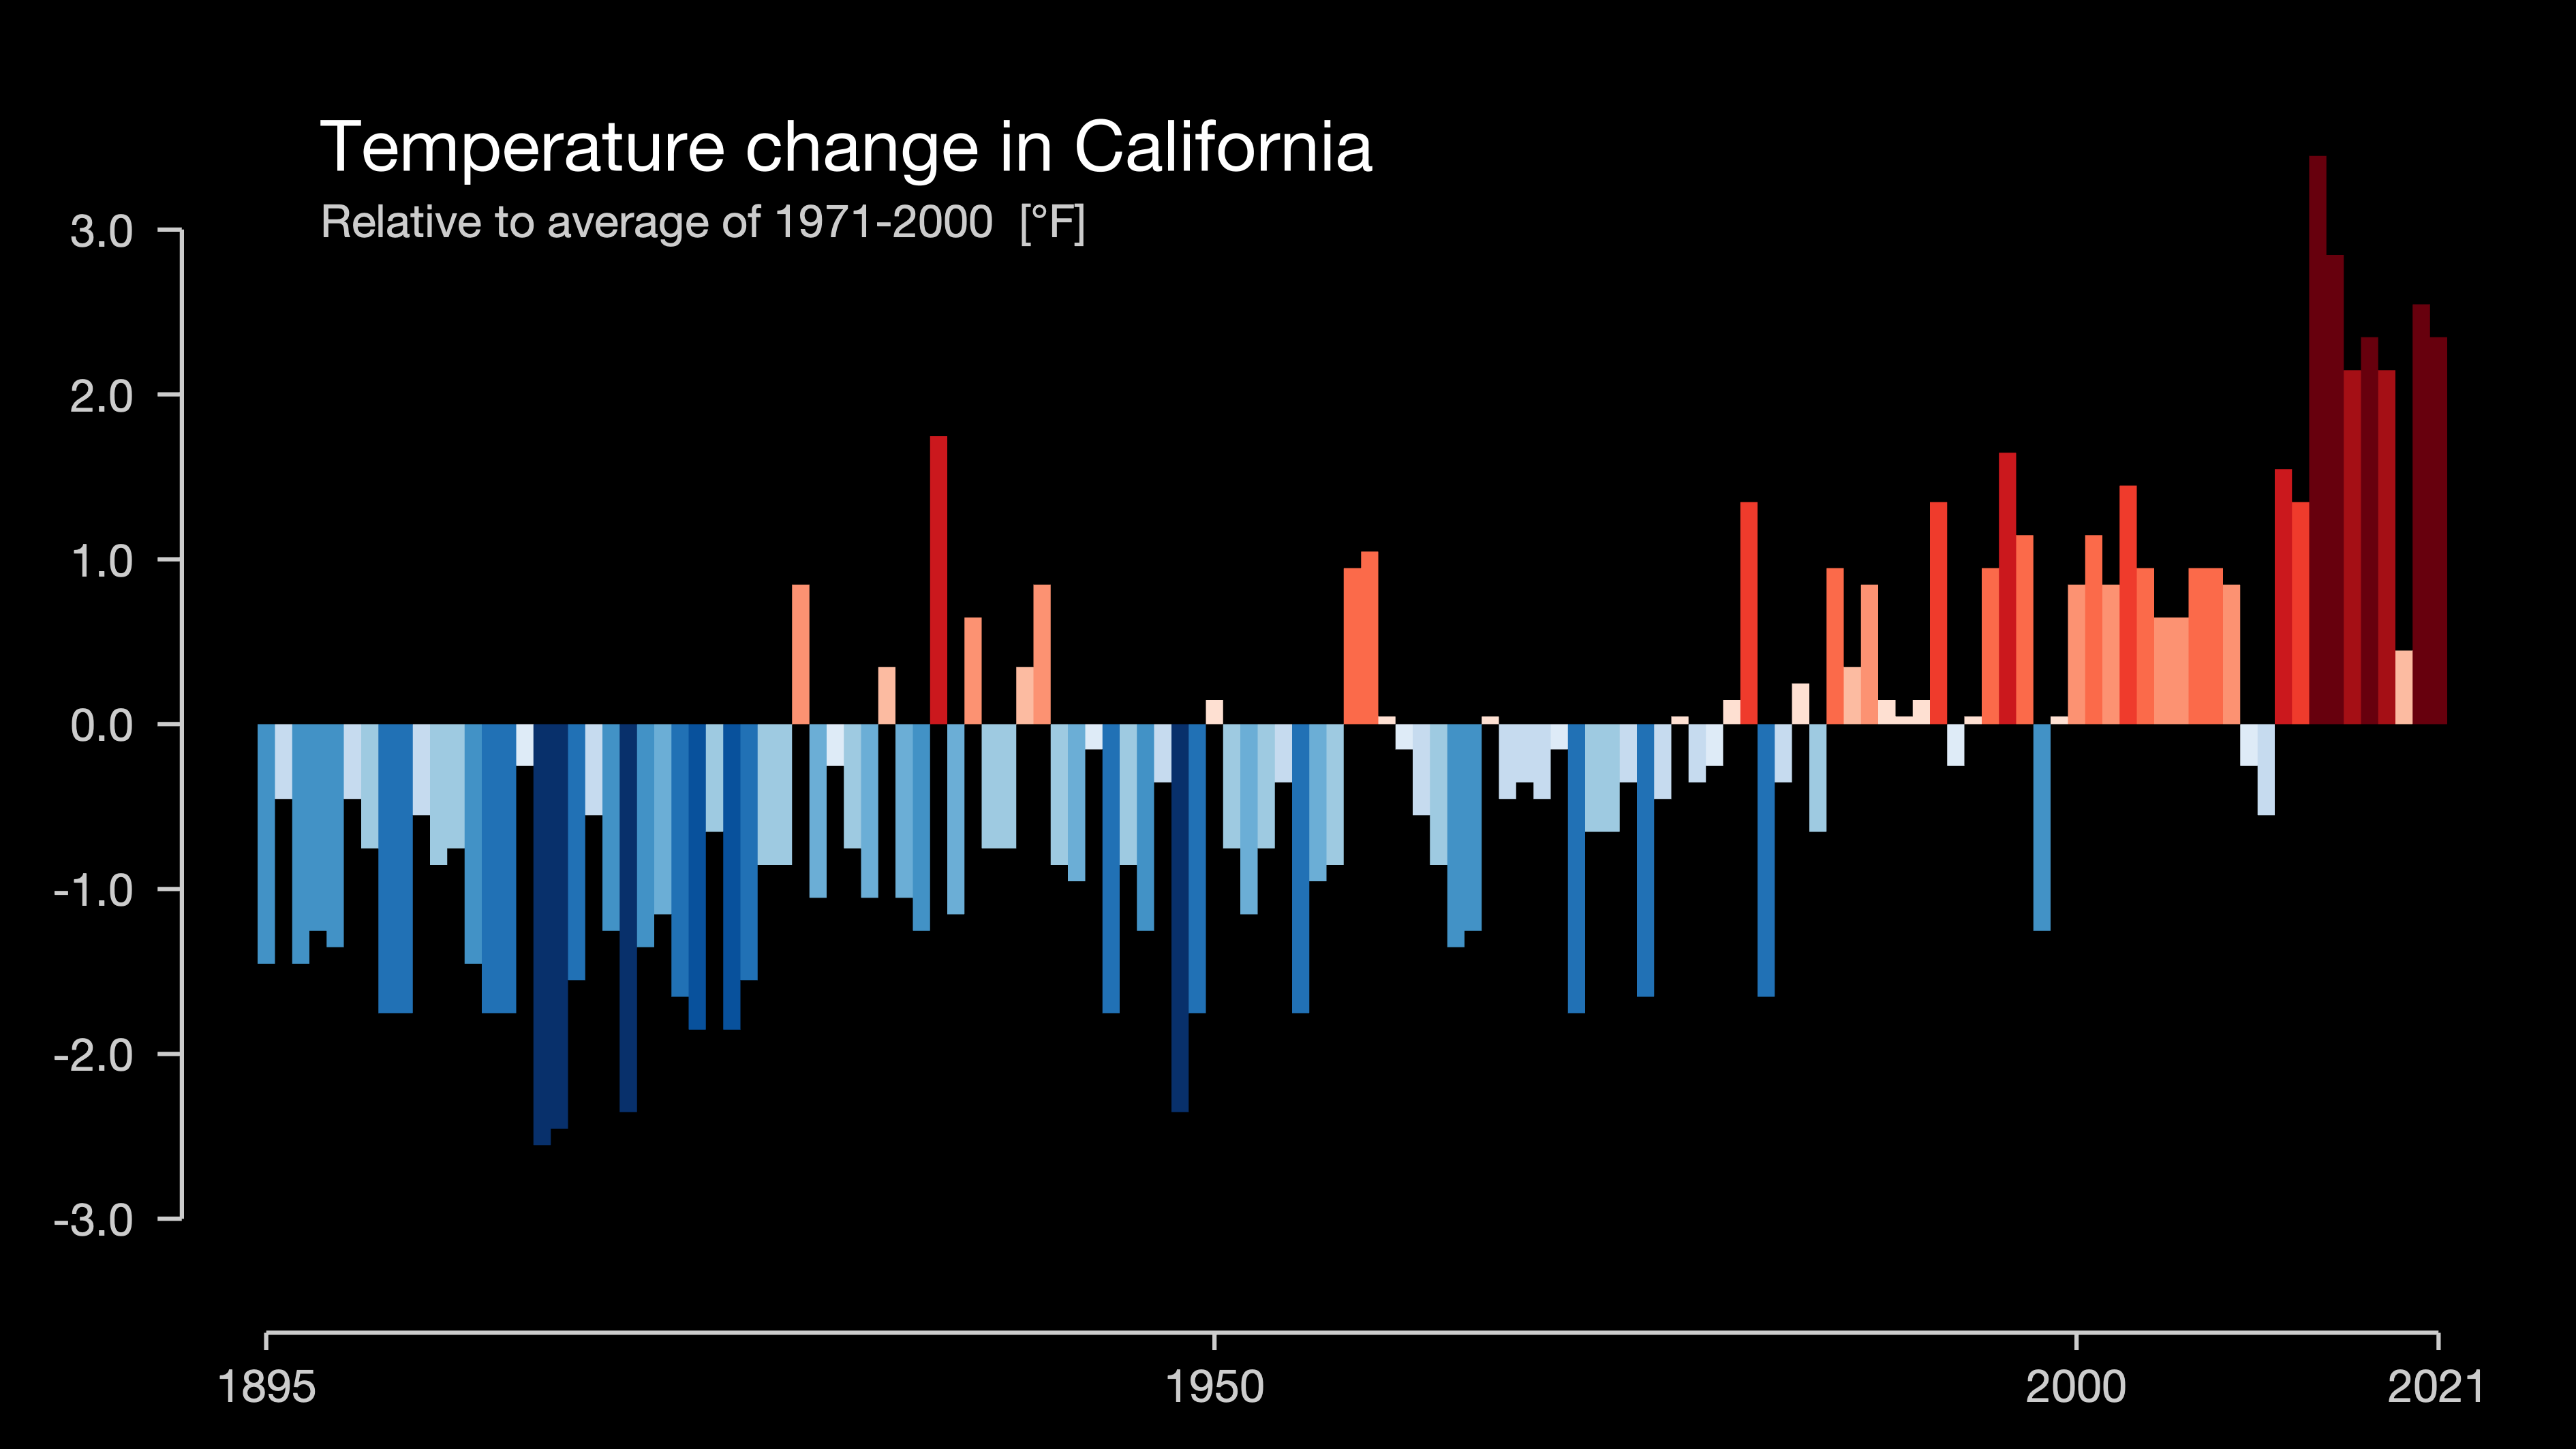
California temperatures steadily rising over last 30+ years. Click on image to view more details on website. Learn more…
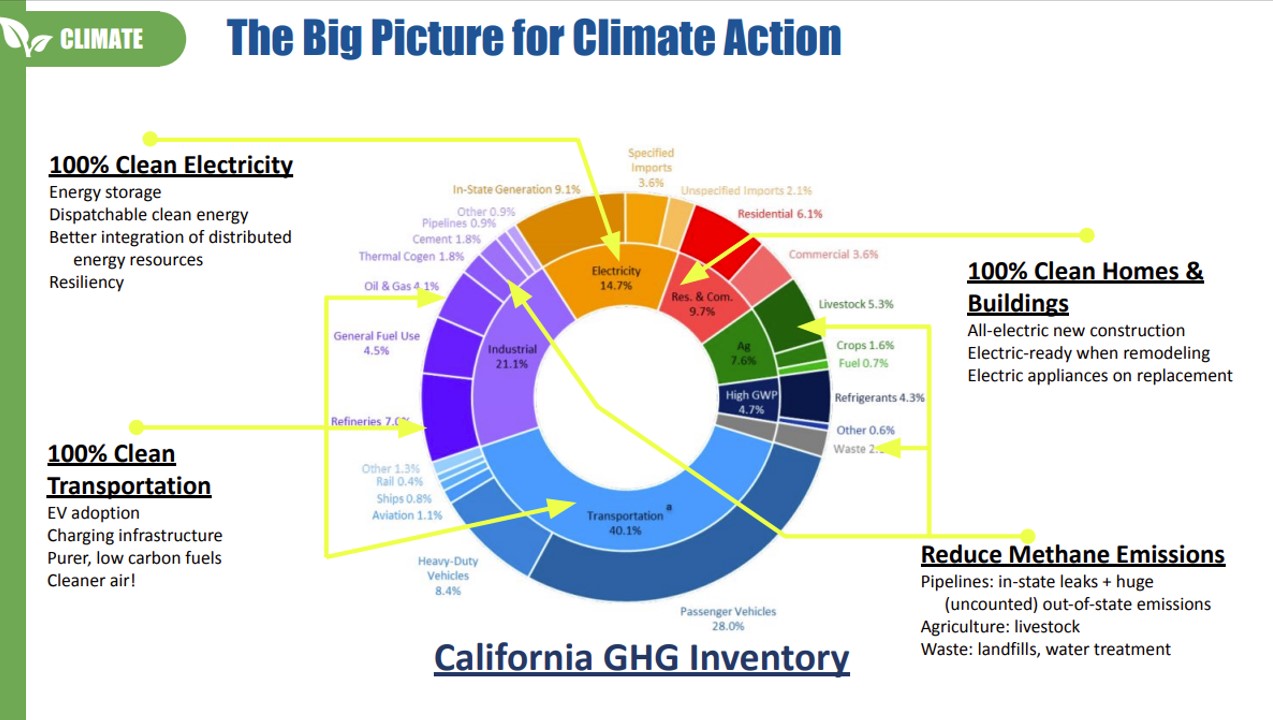
Click image to view more details about California’s largest sources of greenhouse gas emissions
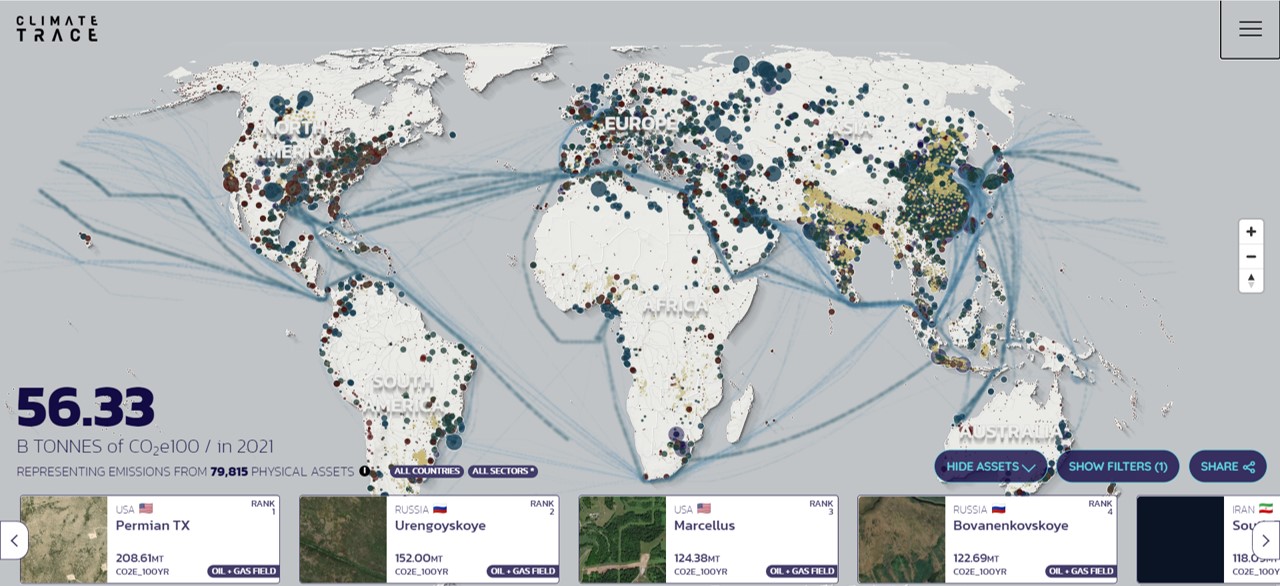
Climate TRACE map is a detailed facility-level global inventory of greenhouse gas (GHG) emissions to date, including emissions data for 70,000+ individual sites — including specific power plants, steel mills, urban road networks, and oil and gas fields — representing the top known sources of emissions in the power sector, oil and gas production and refining, shipping, aviation, mining, waste, agriculture, road transportation, and the production of steel, cement, and aluminum.
NASA Climate Time Machine
Click on image to view animated climate time machine. Learn more…
Climate Change Indicators – USDA/US Forest Service & EPA
Climate Change Metrics: Greenhouse Gases, Weather & Climate, Ocean, Snow & Ice, and more.
- View Menu of topics by clicking on icon in upper left hand corner, next to “Climate Change Indicators”.
- View details by clicking on [ ] above (lower right corner) to expand to full screen, or visit website.