Air Quality and Mobility
Project Highlights
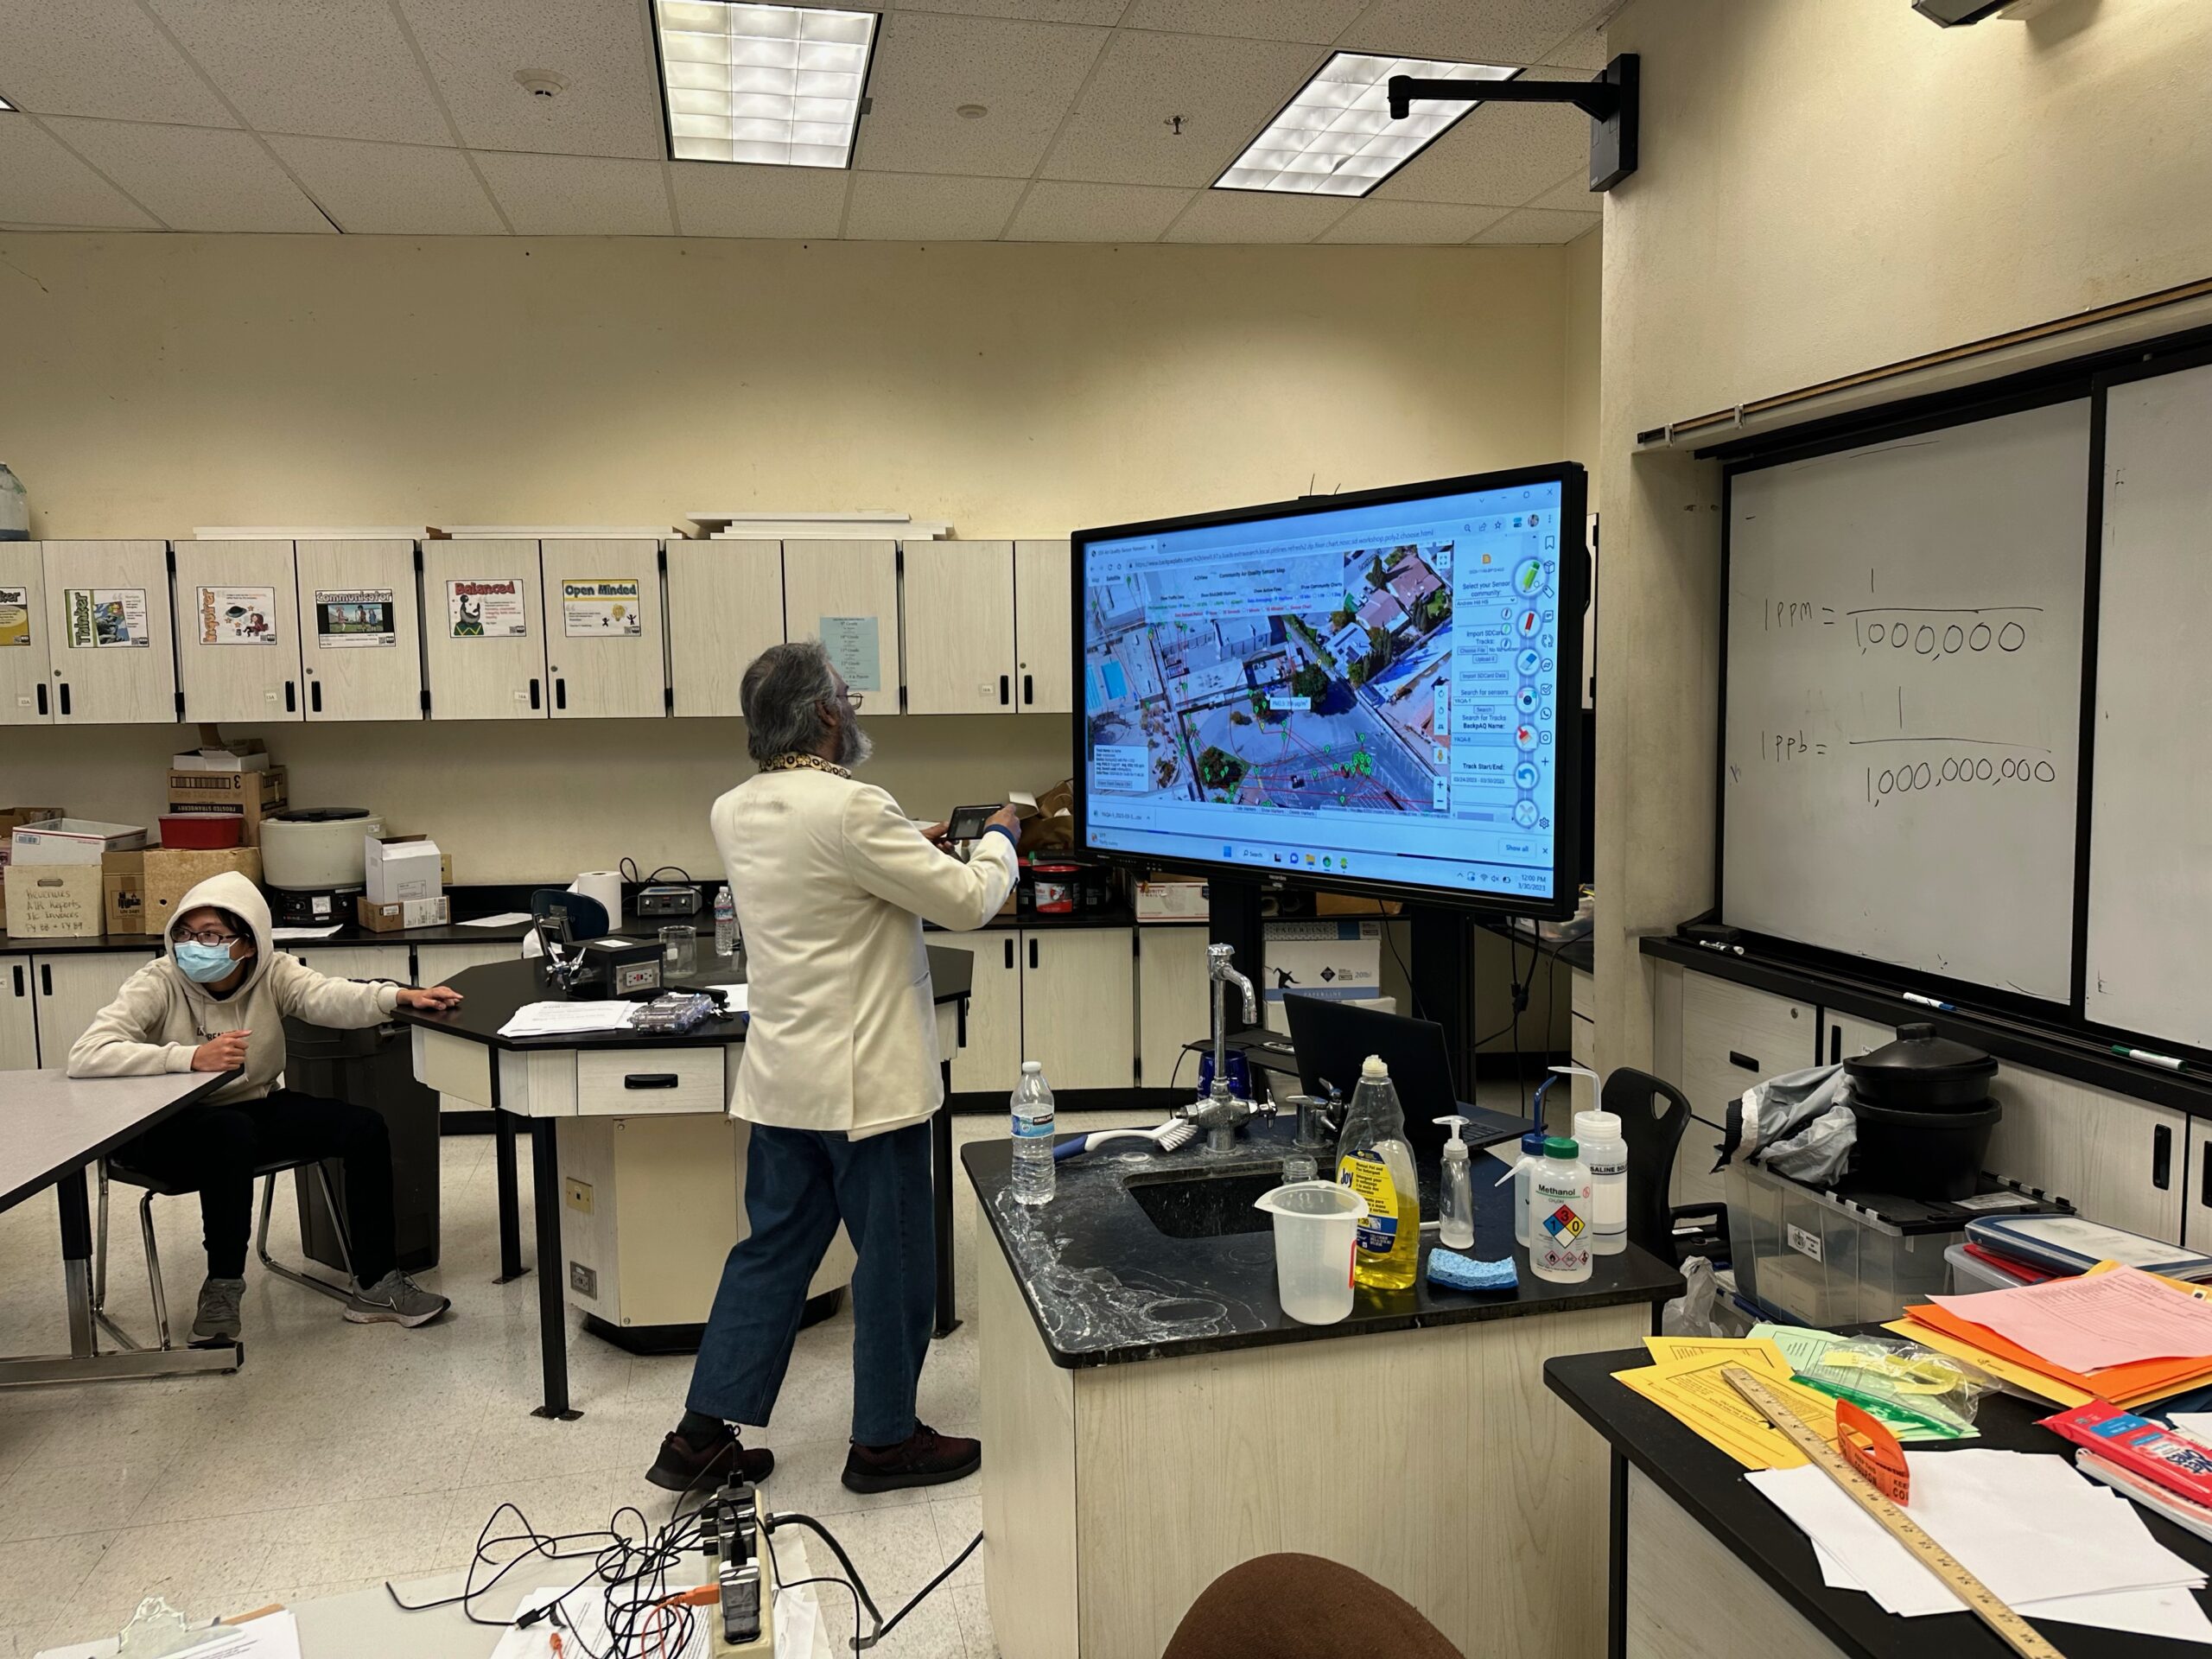
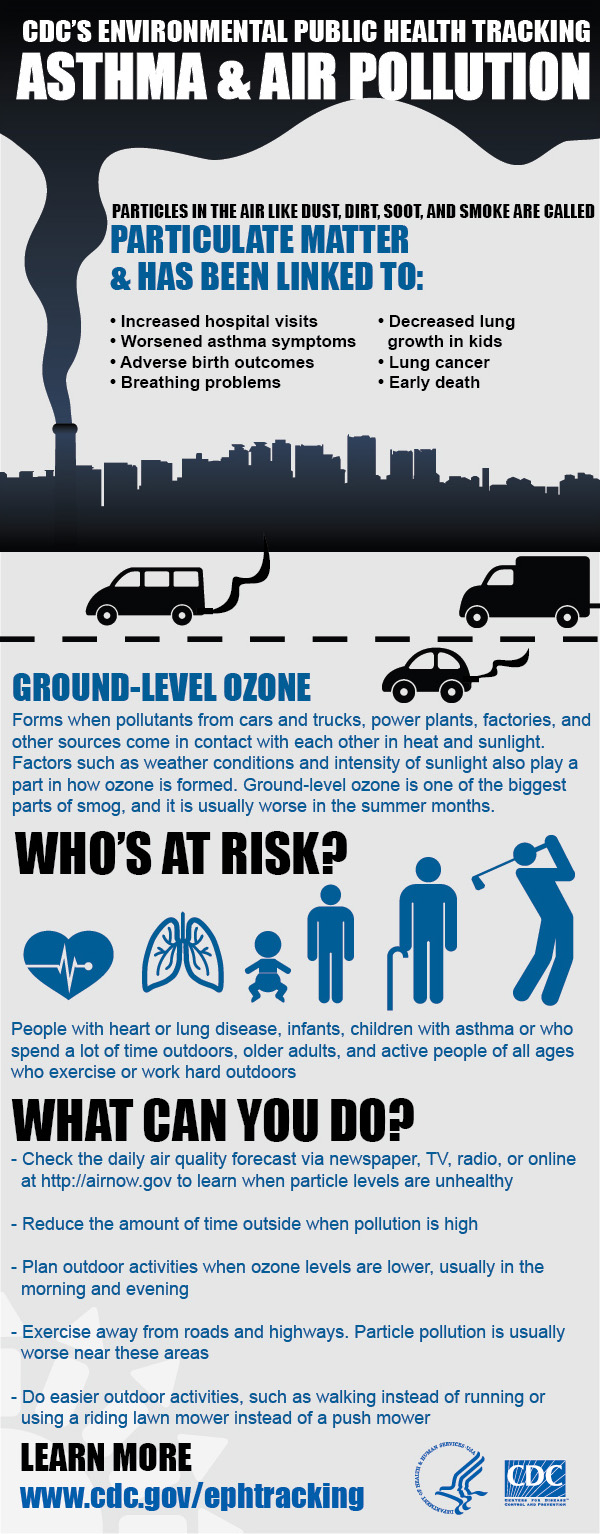
Youth Air Quality Advocates (YAQA)
SSV was awarded a California Air Resources Board (CARB) grant for a two-year Youth Air Quality Advocates (YAQA) project to provide Eastside Union High School District (ESUHSD) teachers with resources and engage students in rigorous STEM-based activities geared toward air pollution and civic action. BAAQMD’s Veronica Eady said, “The Air District is specifically excited about projects that strengthen the youth engagement component of our work, particularly including youth from East San José, one of the Air Districts AB 617 priority communities.” Learn More
Intelligent Transit Signal Priority (iTSP)
To tackle mobility needs in the City of East Palo Alto, SSV formed and led a coalition of representatives from City/County Association of Governments of San Mateo County (C/CAG), SamTrans, startup LYT, and the City of East Palo Alto to deliver an innovative transit signal priority system. Using cloud technology, leveraging GPS location capability, and advanced AI software, the iTSP team demonstrated how the public transit experience can be enhanced and encourage increased ridership, while also reducing GHG emissions (and congestion) from idling buses at traffic lights. Learn more.

Smart Traffic Analytics (Smart TA)
SSV secured Bay Area Air Quality Management District (BAAQMD) funding and created partnership with Green Action, Youth United for Community Action, U.S. Environmental Protection Agency, St. Francis, Firehouse, and YMCA to study the linkage between air pollution and traffic congestion in East Palo Alto.
The project measured traffic congestion and air quality/pollution level data to understand correlations. The results were shared with Stanford public health experts and local government officials for developing targeted interventions and policies to improve community health and environmental conditions. Learn More.
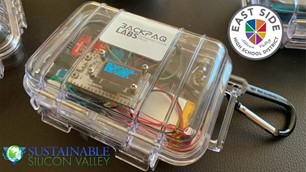
BackpAQ Air Sensor & AQView
SSV developed BackpAQ, a mobile air quality sensor for our community air quality projects. So far BackpAQ has been deployed in the YAQA project, the Clean Air Equity Project (CAEP), and is co-located with a Bay Area Air Quality Management District (BAAQMD) air sensor at Jackson Street in San Jose, CA.
BackpAQ is a low cost air sensor that measures a variety of air quality metrics, viewable on an SSV-developed smart phone app, called AQView. The sensor measures various levels of particulate matter (PM), including PM1, PM2.5, and PM10, as well as displays the US EPA Air Quality Index (AQI).
Air Quality & Public Health